Tag: network dashboard

  • IoTnet is now also available in the Network Dashboard

    IoTnet, a service currently under development by SURF, provides our members with a wireless infrastructure for sensors based on LoRaWAN. As part of the pilot phase, outdoor gateways have been installed throughout the country for this purpose. Indoor gateways have also been installed for individual institutions. Indoor and outdoor gateways are now accessible via the Network Dashboard, SURF’s customer portal for network services.
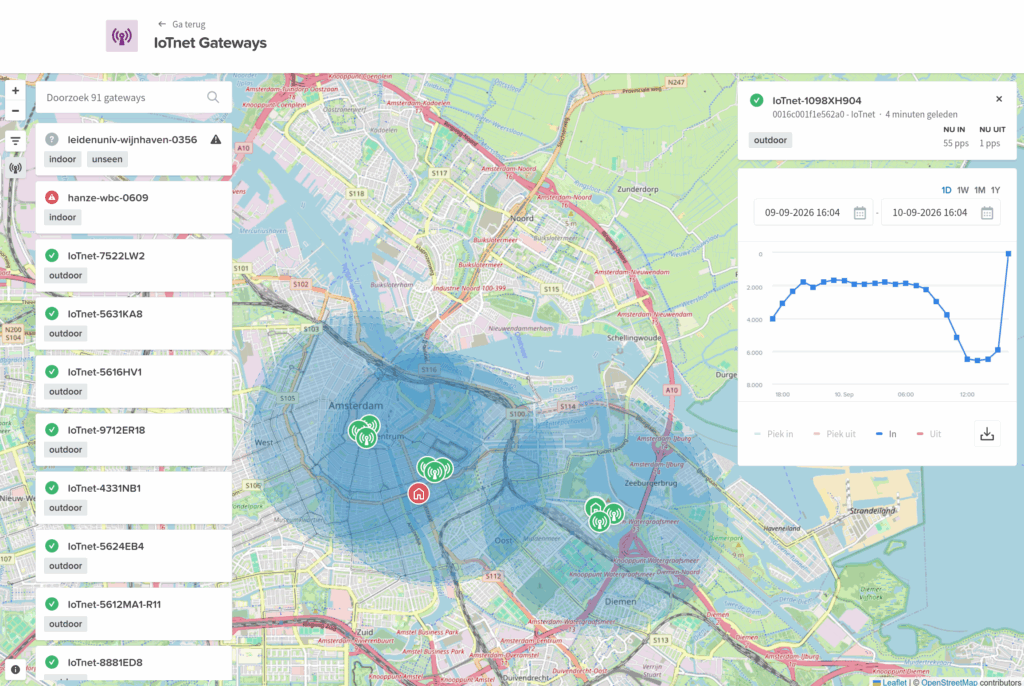
    All organisations and users with access to the network dashboard can view the outdoor gateways. Network administrators can see which gateways are located in their vicinity and what their status is. They can also analyse how much traffic has passed through them recently. If organisations manage indoor gateways as well as outdoor gateways, these are also displayed.

    For example, organisations use IoTnet to collect temperature, humidity or CO₂ readings from climate sensors. This enables them to monitor air quality. Motion sensors are also used to detect no-shows in halls, whilst people counters are used to count the number of people in a room. Furthermore, researchers utilise various sensors to measure soil moisture and temperature, or water conditions.

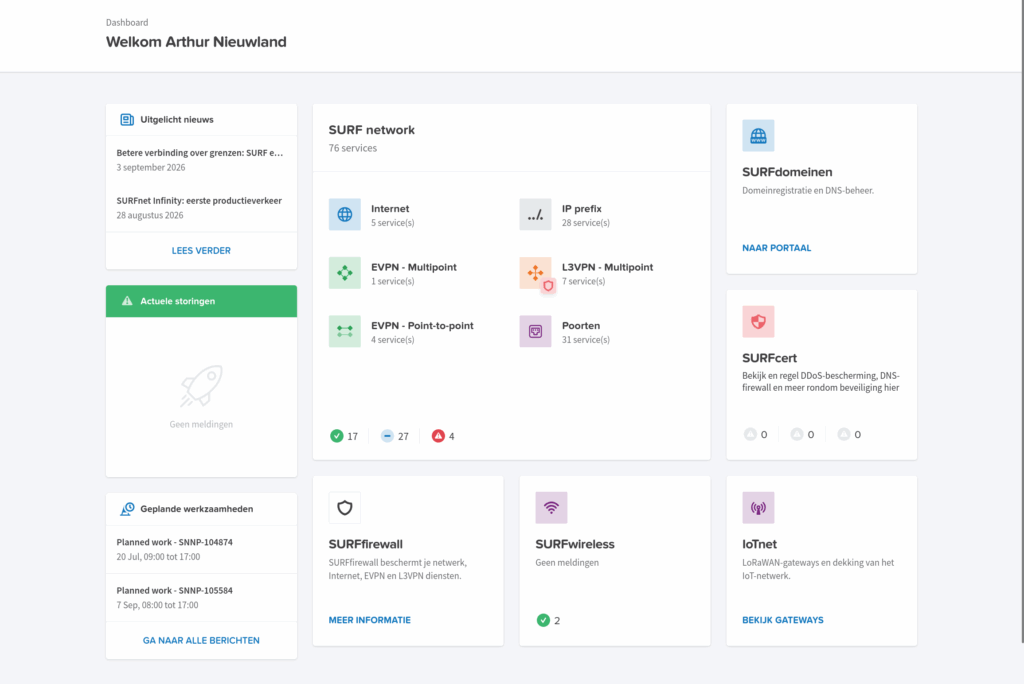
    The Network Dashboard is the portal where administrators can view the status of services. This includes current availability, SLS statistics, traffic graphs and maintenance notifications. Furthermore, for the past year, the SURF Domains service has found a new home there for domain registration and zone management. SURF’s support in the event of cyber-attacks, provided by SURFcert, is also available via the network dashboard.
  • Network dashboard goes electric!

    Network dashboard goes electric!

    Last summer, a huge transition was implemented under the hood of the Network Dashboard. At first glance, little seems to have changed, but especially if you click around, you will now notice that it works much faster. The major overhaul of the network dashboard had been on our wish list for a long time, because the complex authorization rules made the Network Dashboard feel like an old diesel at times (or even slower!).

    The architecture of the Network Dashboard has been completely overhauled by no longer collecting all data from different systems (orchestrator/ipam/CMDB/CRM/jira) in real time, but by preparing all static data in advance in a document in the replica set. As a result, we only have to make a few very fast calls instead of 500 separate API calls. Only the traffic graphs and health status of the services are now retrieved live from the influx database.

    How quickly is such a replica set updated?

    The preparation of these documents in the replica set is triggered with every change to a subscription that the Workflow Orchestrator (see workfloworchestrator.org) executes on a service. The replica is also refreshed every night. This allows us to guarantee the data integrity between the orchestrator and the replica set. Only in the case of real-time changes on the network or due to self-service actions will the replica set briefly lag behind the actual state as recorded in the Workflow Orchestrator. For example, adjusting a customer alias is not immediately visible in the network dashboard, but must be processed in the replica set. Simple changes take ~4 seconds, while larger changes can take many times longer on average. At the moment we are still working on improving the automatic refresh of the pages after self-service actions, until then you will have to manually refresh a page after a change to see the latest up-to-date information.

    SURFdomeinen will be available in the network dashboard early next year. Due to the complex migration of domain names and zones, this will be carried out in phases. The product manager of SURFdomeinen will communicate about this in due time.

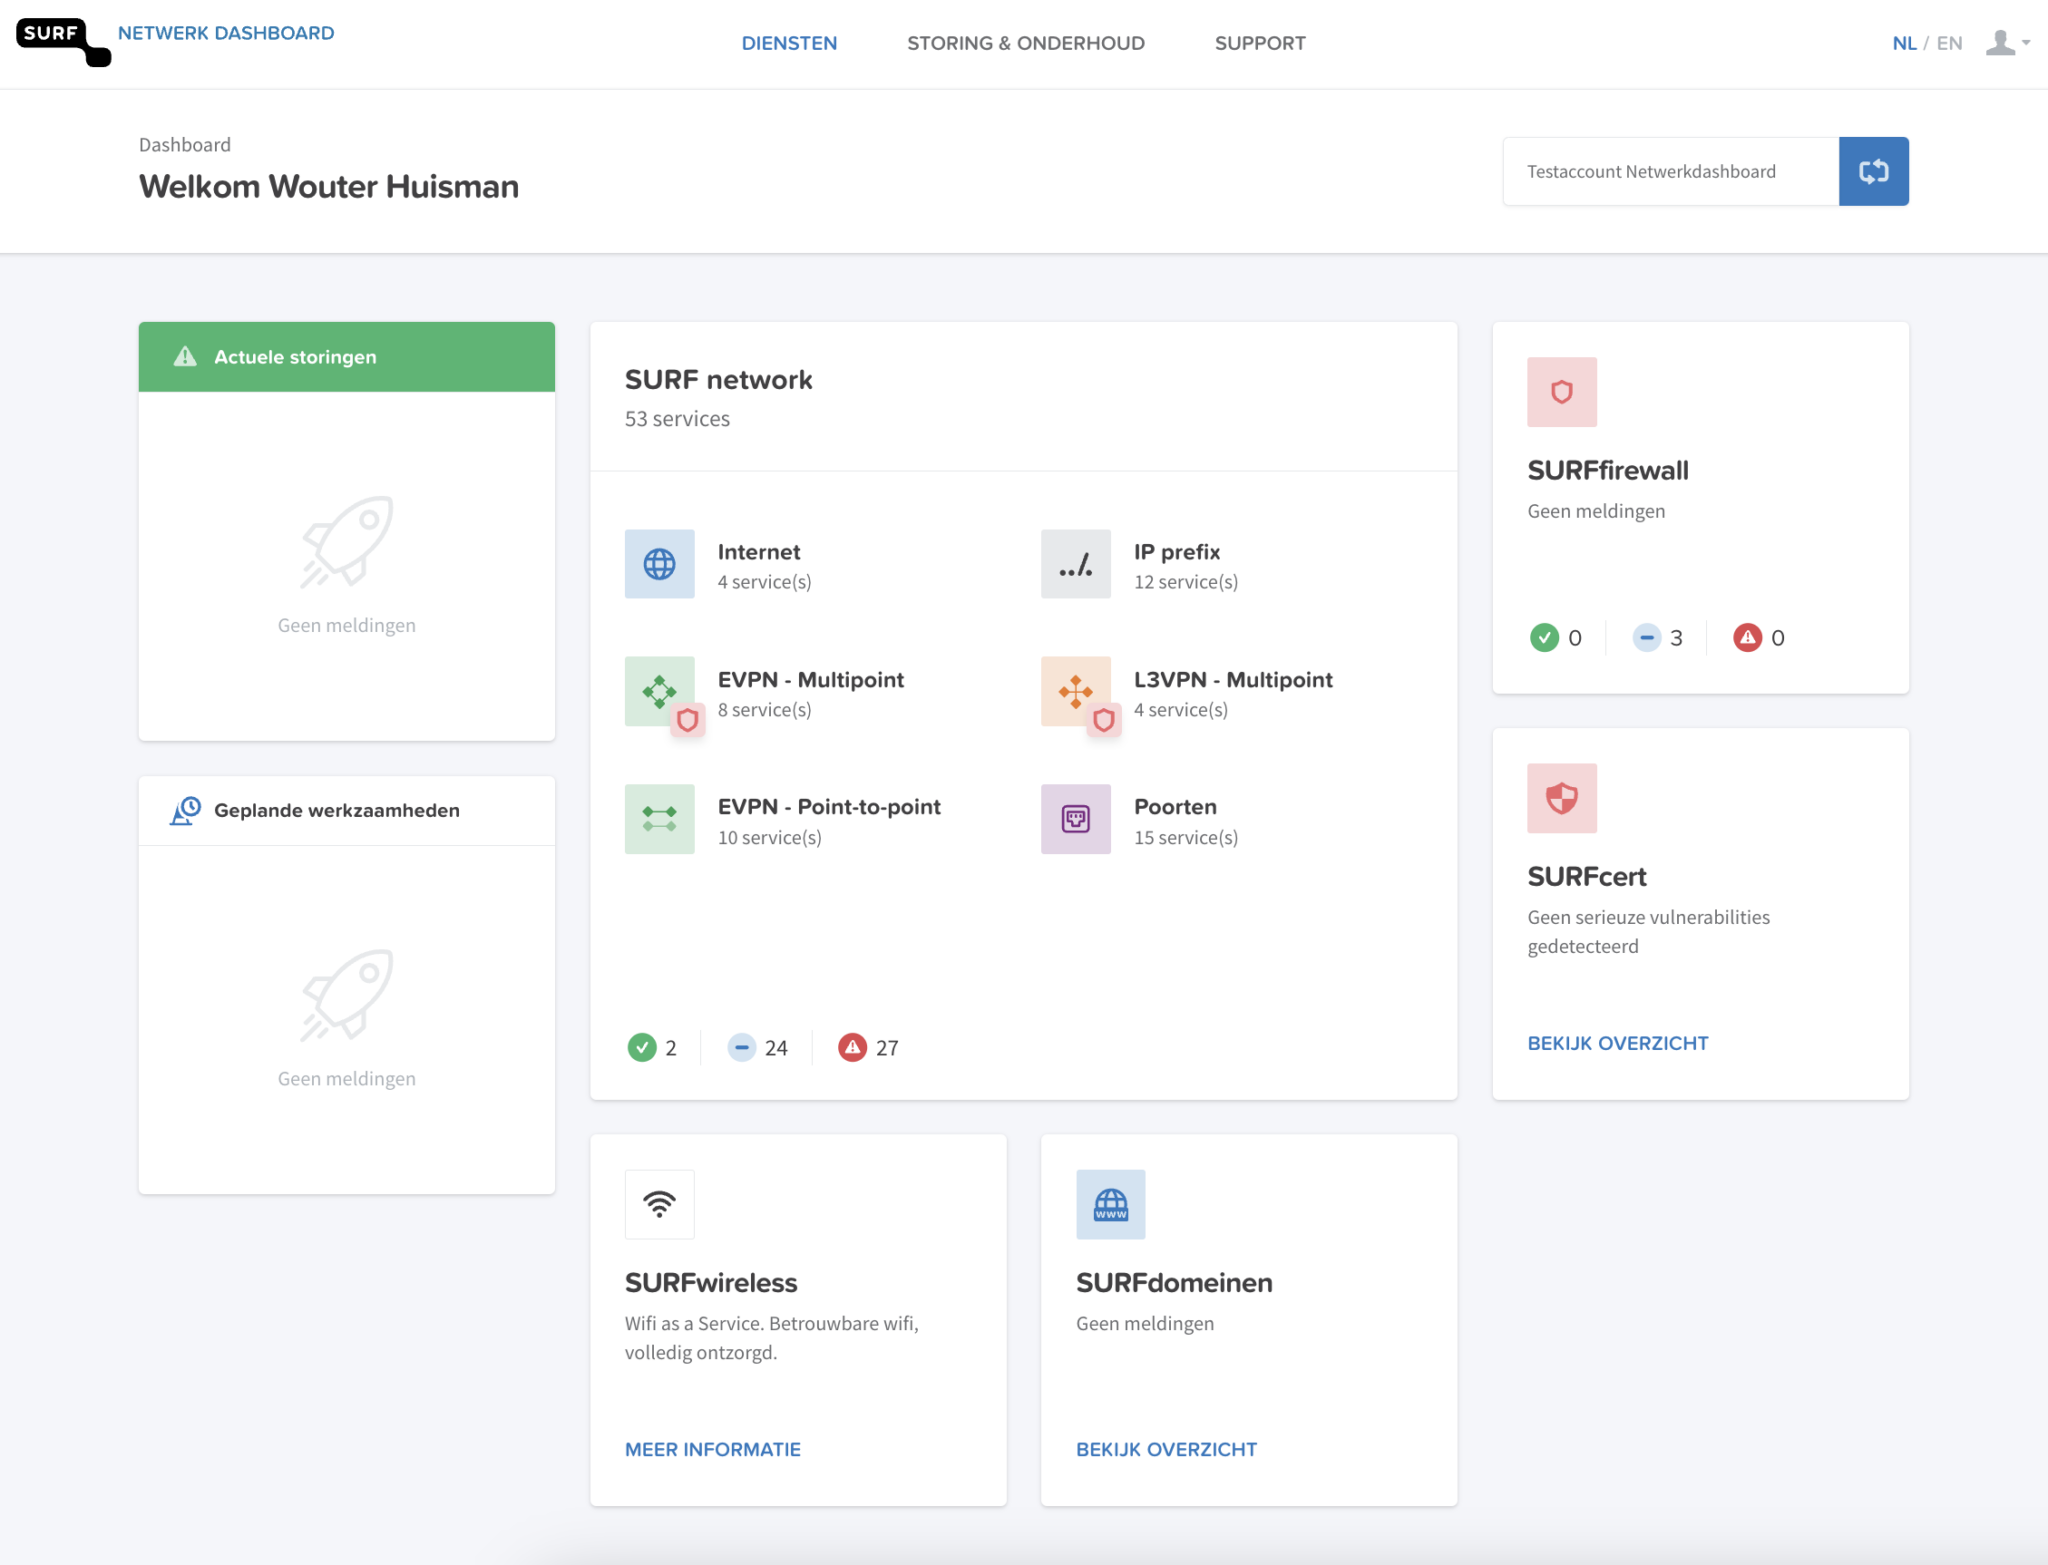
    Finally, we have introduced a new look-and-feel with a renewed landing page, on which all network services of the standard network portfolio are clearly presented in one tile.